According to the International Energy Agency (IEA) total world consumption of energy is projected to increase by one-third to one-half from now through 2035 with most of the increase coming from non-OECD countries. This would be an increase of about 1.4% per year from 495 quadrillion BTU now to 739 quadrillion BTU in 2035.
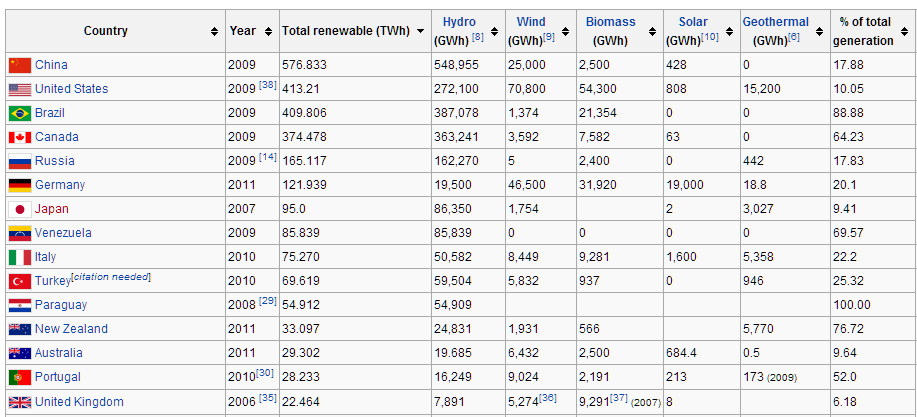
The following chart shows total renewable energy output by country and breaks it down into its components. Germany’s solar power output of 19,000 Gwh dwarfs all other countries as does the United States use of geothermal power at 15,200 Gwh. A number of countries rely almost entirely on hydro-power for their energy. The United States currently leads in wind power generation followed by Germany.
 Source: Wikipedia
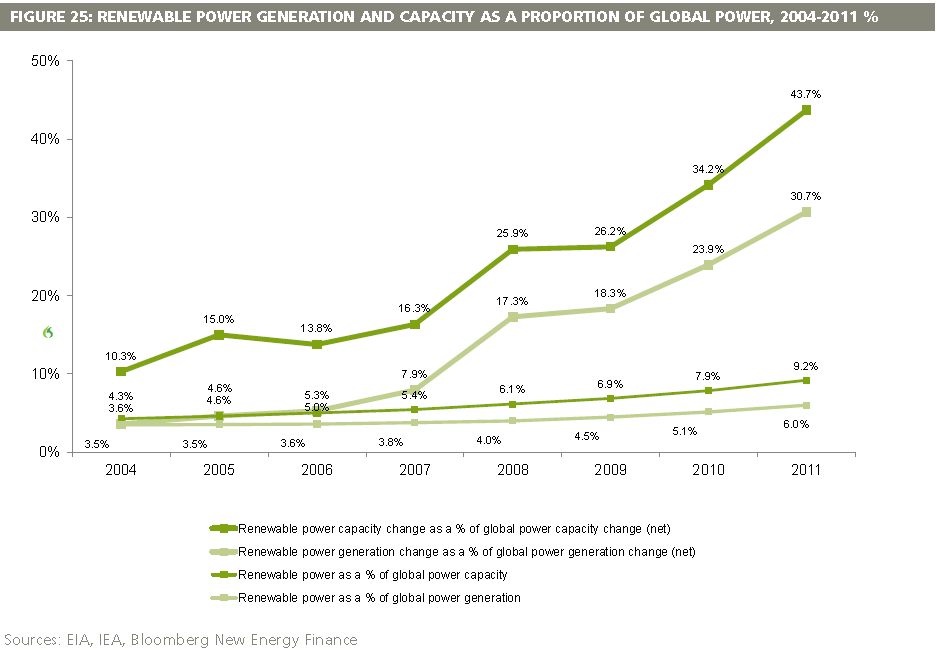
Renewable energy as a percentage of global power
The following chart shows that renewable power currently represents 9.2% of global power capacity. Projections are that this will reach 23% by 2035. Both economic and environmental issues are driving this change.
 Source: Bloomberg New Energy Finance
2035 Snapshot: energy demand, trade and breakdown
The IEA yearly review of global energy provides a thumbnail sketch of the current state of global demand and supply projected to 2035. Note: MTOE stands for megatons of oil equivalent.
The world population, currently estimated at 7 billion, is expected to reach 9.5 billion by 2035. The chart below shows energy use shifting from OECD countries to Asia and the rest of the developing world over the next 35 years; this is where most population increase will occur.
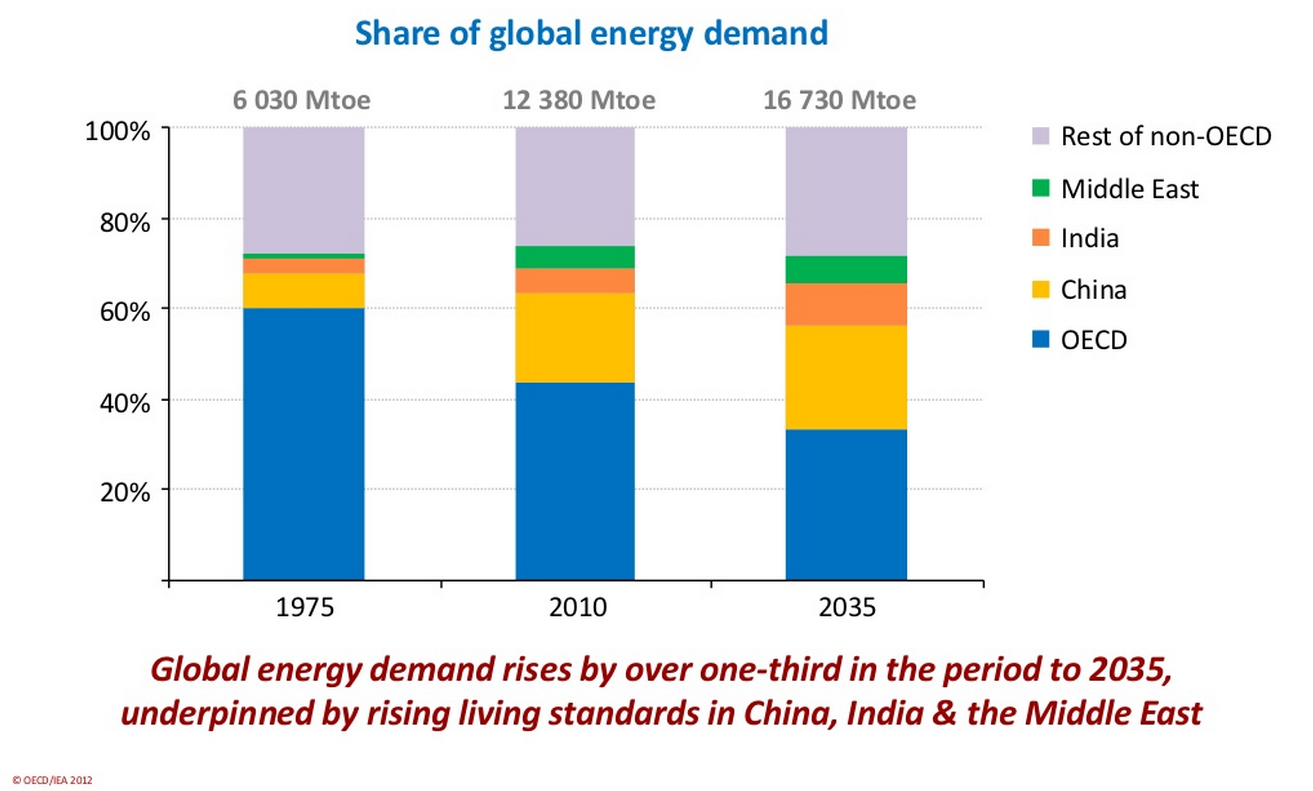 Source: Next 4 slides (IEA):
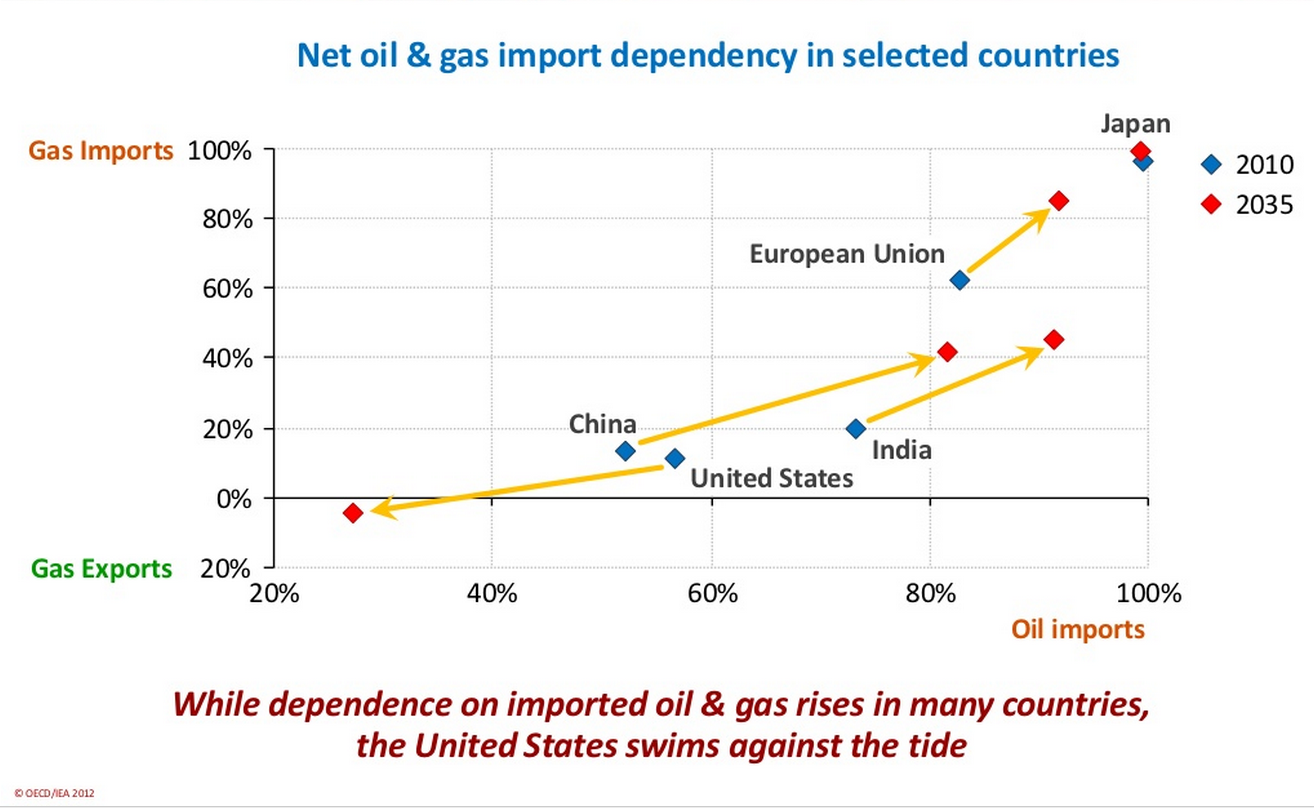
National energy imports and exports going forward
From a supply perspective the US, if not already, will soon become a net exporter of oil and gas while all other major economies will become net importers. The US benefits from new technolgoy that allows it to exploit vast resources, mostly natural gas.
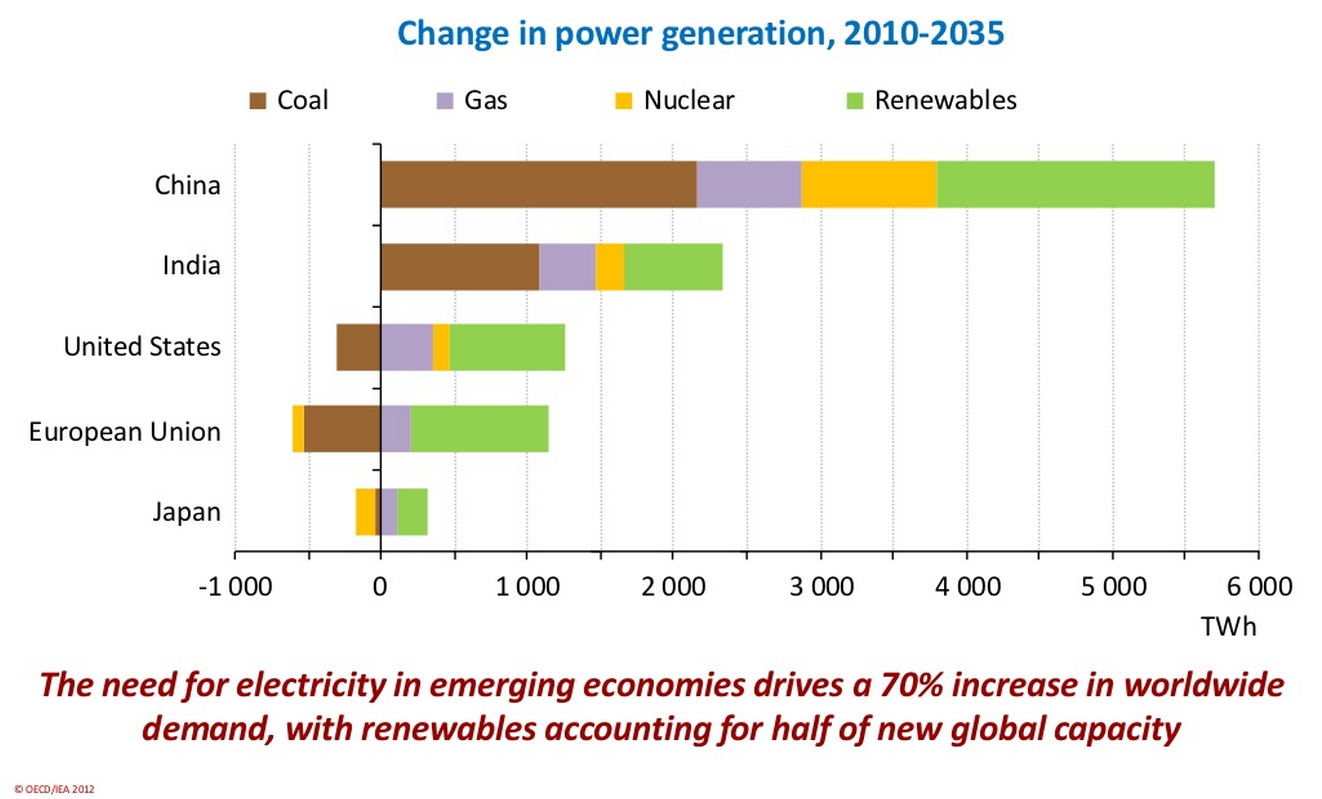
Energy makeup of major economies to 2035
Finally the general trend will be away from finite resources toward renewables between now and 2035. A significant amount of energy will continue to come from coal and improving the “cleanliness” of coal will be a major challenge. Expanding renewable energy resources will help the world meet stringent limits on emissions.
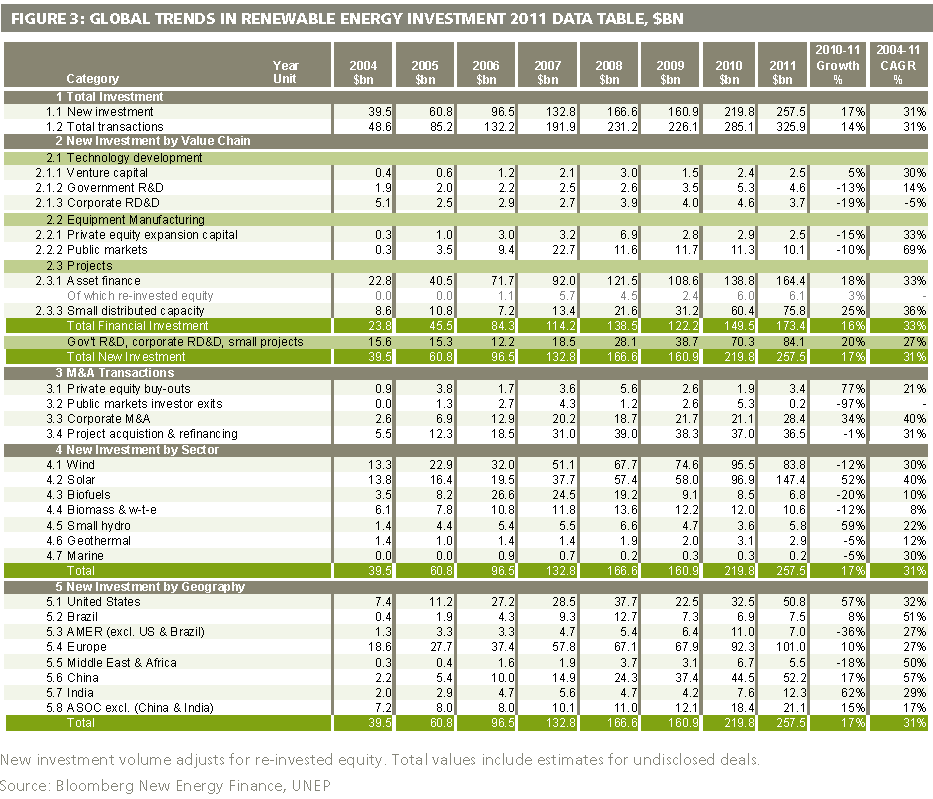
Worldwide renewable energy investment trends
The following chart shows global trends in renewable energy investment by type of investment, sector, and country. All the countries on the list have healthy compound annual growth rates with solar, wind and marine leading the way. Fixing global energy challenges cannot be done without the participation of the financial sector and it is clearly on board.
Source: Bloomberg New Energy Finance
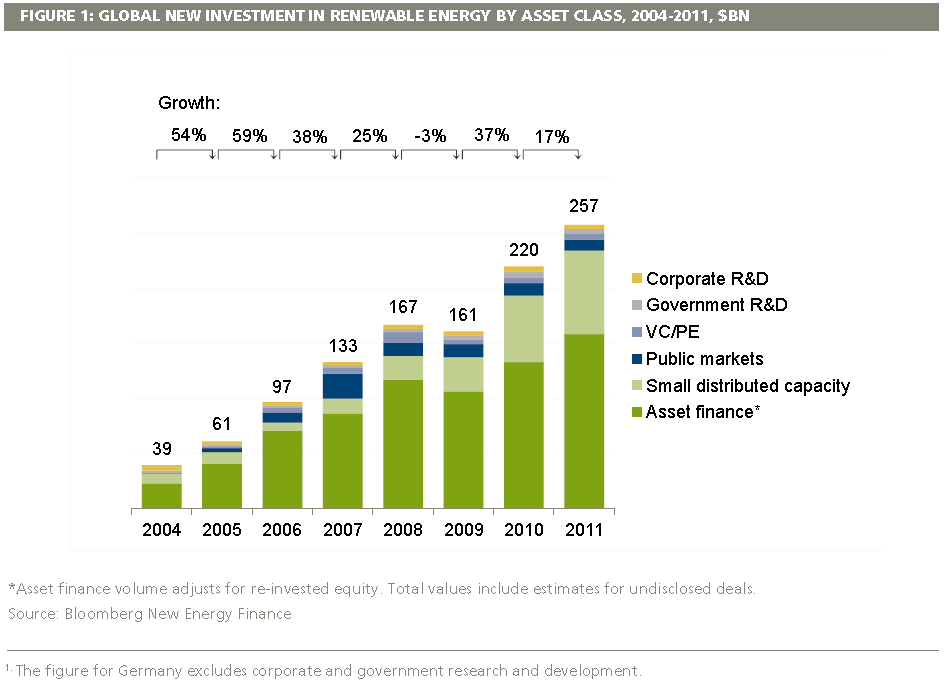
Global investment in renewable energy by asset class
The following chart shows a healthy increase in annual spending on renewable energy from 2004 through 2011. The numbers decreased somewhat in 2009 due to the hangover from the financial crisis but have rebounded somewhat. Much of the increase worldwide is due to the incentive programs for renewable energy that governments are putting in place. Continuing economic challenges and debt around the world especially in Europe, Japan and the United States continue to dampen investment growth.
Source: Bloomberg New Energy Finance
Modeling: An integrated assessment of human climate interaction
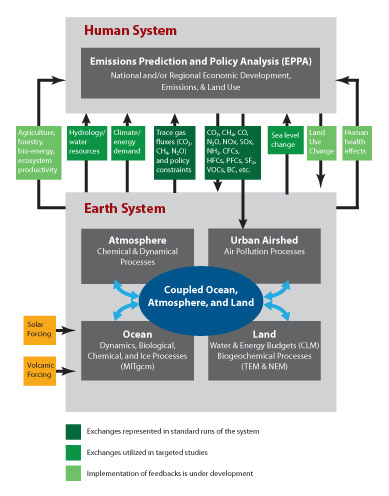
The Massachusetts Institute of Technology (MIT) Joint Program on the Science and Policy of Global Change has developed the “Integrated Global Systems Model” (IGSM) that links the climate system including the atmosphere, oceans, and terrestrial processes to human drivers of global change. The model takes into account potential human responses to climate and other environmental impacts. The integrated model requires multidisciplinary inputs from experts in atmospheric and ocean modeling, soils, terrestrial hydrology, vegetation, atmospheric chemistry and modeling of economic and technological components. The three primary components of GSM are:
- Economics – looks at emissions and a policy cost model to analyze human activity as it interacts with climate processes.
- Climate and earth systems – this looks at the atmosphere and its chemical composition, the ocean, land and natural ecosystems.
- Land ecosystems- this looks at the biochemical exchanges with models in a global framework and includes assessment of the terrestrial biosphere.
The software has been provided to all of the major international forums on the environment including Kyoto and Rio allowing decision-makers of nation states to make assumptions about their country’s emissions and develop reasonable and efficacious policy responses. This software is credited with making the question of global warming “real” for those who have used it. Like any software it is continually being updated and improved.
Source: MIT IGSM
More to come
The world’s response to pollution, climate change and related issues has been impressive. While we are still “behind the eight ball” in some respects, the world is galvanized in coming up with ways to restructure the energy sector and rework the way economies operate so future generations can not only survive, but thrive on planet Earth. We are in the early innings!
In coming articles on renewable energy we will explore each new energy sector, the technology underlying it, and its worldwide implementation and growth. Stay tuned!
Terminology
Alternative Energy – typically refers to alternatives to nuclear energy and fossil fuels.
Renewable energy – this is energy that comes from renewable natural resources such as wind, rain, sunlight, geothermal heat, and tides. It’s renewable because it doesn’t run out. With concerns about nuclear energy and the depletion of finite resources humans are now looking to renewable natural resources to solve long-term energy issues.
Clean energy – this refers to sources of energy that are clean and nonpolluting. Most but not all renewable energy sources are clean energy resources.
Related Posts on IndustryTap:

