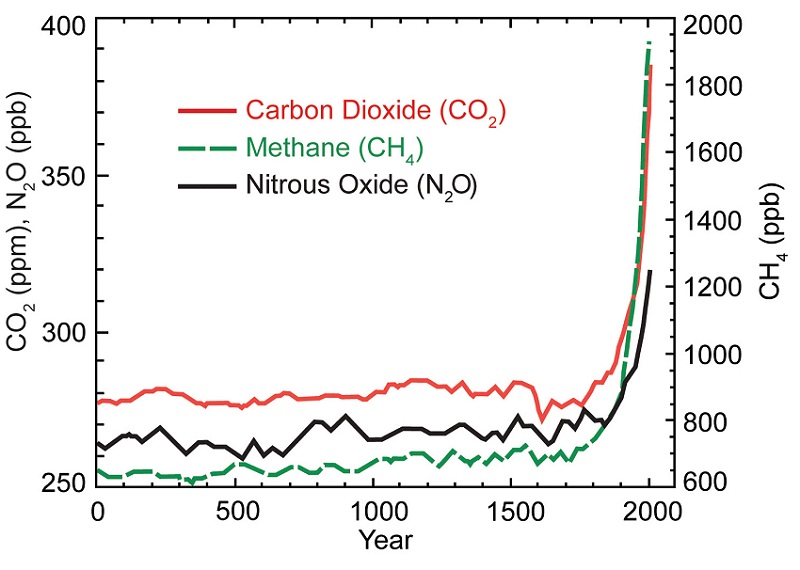
IndustryTap covered “300 Years of Fossil Fuels in 300 Seconds” which shows the origin and growth of greenhouse gases since the beginning of the Industrial Revolution in the 17th century; CO2 is measured in Parts Per Million (PPM) and its growth spurt is unmistakable. Charts below from the Environmental Protection Agency (EPA) tell an interesting tale: the world must cooperate and all major sectors of the world economy reformed if sustainability is to be achieved.
Trends In GHG Emissions
Renewable Energy Chipping Away at GHG Emissions But Progress on More Fronts Needed
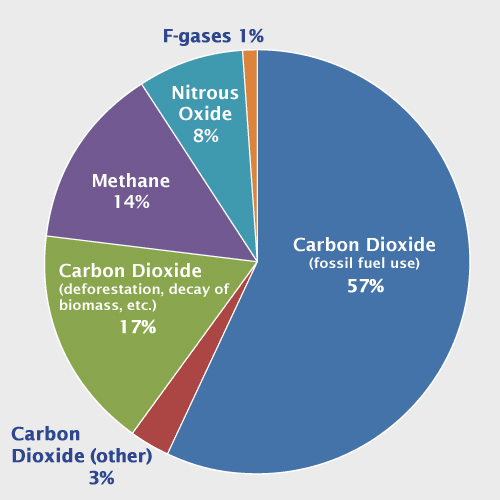
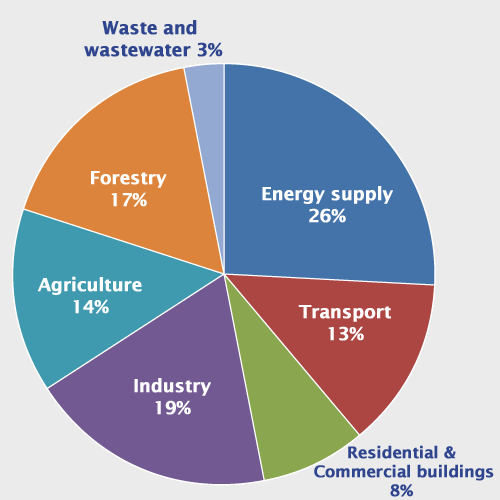
If humans are ever to gain control of runaway greenhouse gases, we will need to do it on a variety of fronts. The accompanying charts show greenhouse gases by gas and source. The burning of fossil fuels is the biggest culprit and much is being done to reduce it as a percentage of overall energy supply: the adoption of solar, wind, geothermal, hydroelectric and others will go a long way toward reigning in this piece of the pie.
The next 3 largest: industry, transport and forestry are also being “chipped away.” Cutting down of trees is being mitigated by replanting programs and the use of materials that replace wood. Transport now has a new electric vehicle industry and smarter mass transit systems like electric monorails that will significantly curb emissions.
Elon Musk’s safe, low energy “Hyperloop” could also advance the interests of sustainability as we’ve discussed recently in “Meet The Real Iron Man.”
New Technologies to Help Industry Mitigate Emissions
Industry is adopting many of the above alternative energy resources, already reducing its carbon footprint. Now there are a series of new technologies being adopted by industry that will squeeze emissions even further.
For example, IndustryTap recently wrote “Can a Revolutionary New Gas Eliminate All The World’s Pollution?” detailing how new technology can vastly improve smokestack scrubbing and reduce emissions by more than 90%
Another example involves MIT’s John F. Elliott, Professor of Materials Chemistry, and colleagues who recently published a breakthrough paper in Nature. Worldwide steel production of about 1.5 billion tons per year generates 3 billion tons of CO2 emissions; with a new process called “Molten Oxide Electrolysis” (MOE) byproducts of steel production can be converted into pure oxygen (02).
Following is a summary of the article in Nature:
Molten oxide electrolysis (MOE) is an electrometallurgical technique that enables the direct production of metal in the liquid state from oxide feedstock1, 2, and compared with traditional methods of extractive metallurgy offers both a substantial simplification of the process and a significant reduction in energy consumption3. MOE is also considered a promising route for mitigation of CO2 emissions in steelmaking3, 4, 5, production of metals free of carbon6, and generation of oxygen for extra-terrestrial exploration7, 8. Until now, MOE has been demonstrated using anode materials that are consumable (graphite for use with ferro-alloys and titanium6, 9) or unaffordable for terrestrial applications (iridium for use with iron10, 11). To enable metal production without process carbon, MOE requires an anode material that resists depletion while sustaining oxygen evolution. The challenges for iron production are threefold. First, the process temperature is in excess of 1,538 degrees Celsius (ref. 10). Second, under anodic polarization most metals inevitably corrode in such conditions11, 12, 13. Third, iron oxide undergoes spontaneous reduction on contact with most refractory metals14 and even carbon. Here we show that anodes comprising chromium-based alloys exhibit limited consumption during iron extraction and oxygen evolution by MOE. The anode stability is due to the formation of an electronically conductive solid solution of chromium(III) and aluminium oxides in the corundum structure. These findings make practicable larger-scale evaluation of MOE for the production of steel, and potentially provide a key material component enabling mitigation of greenhouse-gas emissions while producing metal of superior metallurgical quality.
Breakdown Of Greenhouse Gases
As noted above, the following charts show our current state of affairs with respect to greenhouse gases including: concentration, origin, and location. The only reasonable conclusion is that concerted collective effort is needed for any hope at making progress.
Greenhouse Gas Emissions By Industry
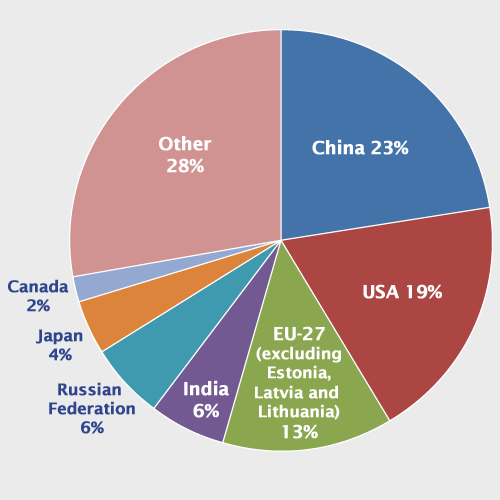
Emissions by Country
The following chart shows China in the lead with the US second and the EU third. If the world is to get control over greenhouse gas emissions, multilateral cooperation is essential.
For information on the impact of each greenhouse gas, visit the EPA here.

